
Learn It

What are graphs, charts and tables?

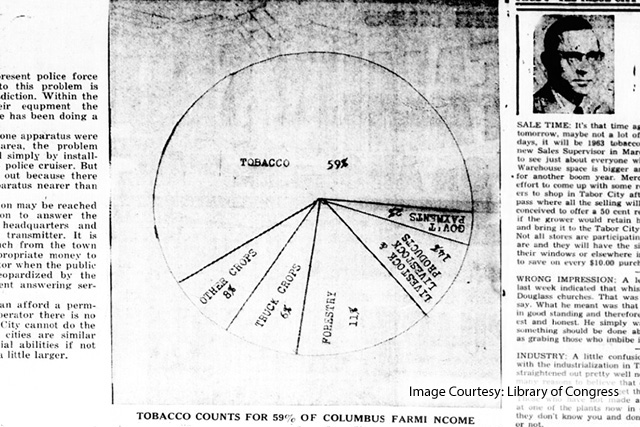
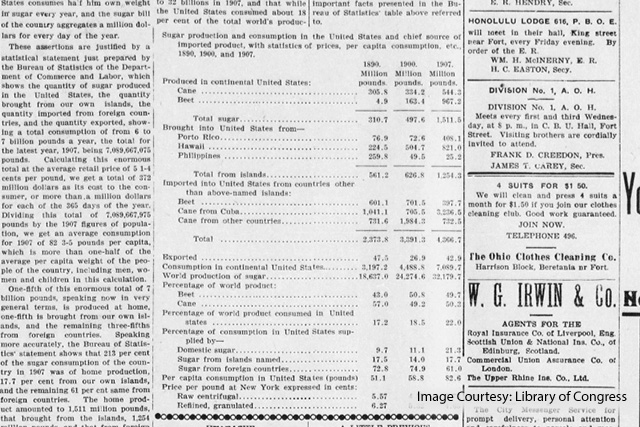
There is an old saying that "one picture is worth a thousand words." It's true for graphs, charts, and tables. They are great ways to put a lot of data into one place.

Click through the slideshow below to learn more about graphs, charts, and tables.

Speaker plays audio

Features of Graphs, Charts and Tables


title screen image of graph

What is a graph?

A graph is picture that uses dots, lines or bars to show how something changes.


image of a line graph

Image credit: Library of Congress


Line Graph:

A line graph has straight lines that go from dot to dot. The line shows how something changes over time. Line graphs are good for showing small changes.

This line graph shows the sales for one week at a food store in Greenbelt, MD, between January 1938 and October 1938. Look carefully at the direction of the line. What does it show about the store’s sales during this ten months?


image of a bar graph

Bar Graph:

A bar graph (or chart) has thick straight lines – or “bars” -- next to each other. Each bar shows a different time or a different part of something. Longer bars mean more, and shorter bars mean less. Bar graphs are good for showing big changes. They can also show things that are the same or different over time.

This bar graph is from 1939. It shows how much money stores in Greenbelt, MD, made each month. Each bar shows a different month. Each pattern in the bar shows a different store. It looks like Greenbelt businesses made more money every month in 1939.


image of a pie chart

What is a chart?

A chart is a picture that has just a few words. The parts of the picture give the information. Charts make it easy to understand a lot of information that goes together. Sometimes graphs are called charts.


image of a pie chart in a newspaper

Pie chart:

Pie charts are round and cut into different sized parts – kind of like a pizza, except the slices are often different sizes. The size of each slice indicates how much of the whole thing that item is.

This pie chart is from 1963. It shows that farmers in Columbus County, NC, made 59% of their money by growing tobacco.


image of table in a newspaper

What is a table?

A table is a list of words or numbers about a topic. A table has a lot of information in one place.

This table is from 1909. It shows how many pounds of sugar the United States bought from other countries in 1890, 1900 and 1907.


Analyzing Historical Sources

My teacher, Mr. Lexington, says that charts, graphs and tables will be useful for my history day project – if I learn to analyze them correctly.

Mr. Lexington taught us the steps to analyze sources. Here, let me show you.

Wait! You’re not done yet! After you’ve gone through the three steps, you can go back to step one and see if you have any new observations!