Welcome!
This collection of interactive math lessons is designed for middle school students and aligns to the Common Core State Standards in Mathematics. Each lesson is self-paced and can be completed in about 20 - 30 minutes. These 20 lessons, developed and built by MPT, are part of a larger "Math at the Core" collection on PBS Learning Media. Each lesson below links to the full lesson on MPT and a shorter version on PBS Learning Media. (Users must register on PBS after several visits.)
This project was produced with funding from the Corporation for Public Broadcasting.
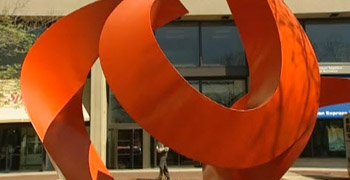 A Focus on Surface Area and Scale Drawings Grades: 6 - 7 > Full Lesson > PBS link Students will examine how modern art sculptor Mary Ann Mears uses surface area to design and build large three-dimensional sculptures. Focus: Surface Area, Scale Drawings
|
 Building Sculptures Grades: 6 - 7 > Full Lesson > PBS link Students will learn how sculptors use area and volume when constructing a figure, and they will find area and volume of three-dimensional figures. Focus: Volume |
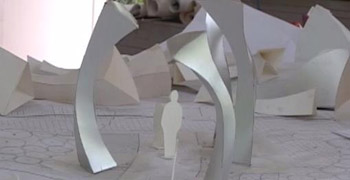 Mapping Out Sculptures Grades: 7 - 8 > Full Lesson > PBS link Students will explore how sculptor Mary Ann Mears uses angle measures to plan the construction of her sculptures. Focus: Special Angle Pairs, Triangles and Geometric Constructions
|
 The Soccer Field Grade: 6 > Full Lesson > PBS link Students will learn how to graph solutions to inequalities by exploring the dimensions of a soccer field. Focus: Writing and Graphing Inequalities in One-Variable |
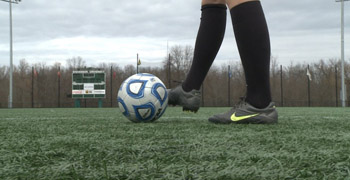 Angles in Soccer Grade: 7 > Full Lesson > PBS link Students will learn how to measure angles with a protractor as they explore the angles of soccer players’ legs during various types of kicks. Focus: Arc Measures and Arc Length
|
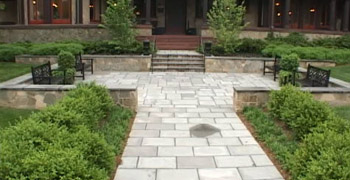 Transformations in Landscaping Grade: 8 > Full Lesson > PBS link Students will examine how reflections are used in landscape architecture, and they will practice reflecting images on coordinate grids. Focus: Transformations
|
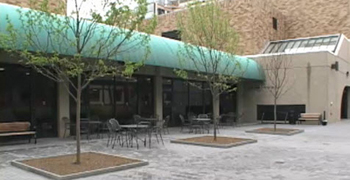 Congruency and Transformations in Landscape Architecture Grade: 8 > Full Lesson > PBS link Students will explore how congruency in transformations is used in landscape architecture, and they will identify transformations that show congruency. Focus: Congruency in Transformations
|
 From Mars to Mardi Gras: A Lesson in Generalizations Grade: 7 > Full Lesson > PBS link Students will learn how NASA can take random samples of soil from the surface of Mars and form generalizations. They will practice making valid generalizations about the popularity of Mardi Gras King Cake. Focus: Forming Generalizations About Populations |
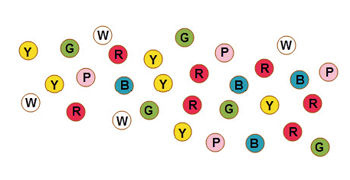 Simple Random Sampling Grade: 7 > Full Lesson > PBS link Students will use simple random sampling to draw inferences about the proportions of specific types of candy in a candy jar and the number of words in a Shakespearian sonnet. Focus: Drawing Inferences About Populations
|
 Relative Frequency and Probability Grade: 7 > Full Lesson > PBS link Students will learn how to approximate the probability of a chance event, like free-throw shots, by collecting data and observing its long-term relative frequency. Focus: Relative Frequency and Probability Common Core Alignment: 7.SP.C.6 |
 Functional Relationships Grade: 8 > Full Lesson > PBS link Students will interpret graphs of basketball passes and describe the functional relationship shown in each graph. Focus: Functional Relationships
|
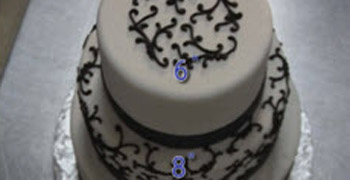 Unit Rates and Slope Grade: 8 > Full Lesson > PBS link Students will learn how cake designers use proportion and slope to make attractive cakes. They will predict who will win a cupcake baking contest by identifying the unit rate for each baker. Focus: Proportional Relationships and Slope
|
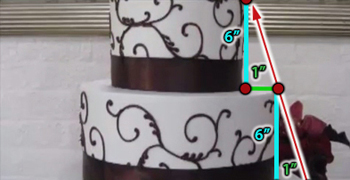 Proportional Relationships and Slope Grade: 8 > Full Lesson > PBS link Students will explore how designing cakes with an appropriate slope affects the cake design, and they will practice identifying the slope of lines. Focus: Similar Triangles and Slope
|
 Displaying Data With Line Plots Grade: 5 > Full Lesson > PBS link Students will use data of football players' heights and hand-span lengths to make line plots that represent the data. Focus: Displaying Data With Line Plots |
 Probability and Tree Diagrams Grade: 7 > Full Lesson > PBS link Students will use tree diagrams to represent the outcomes and probabilities involved in compound events such as dice rolls and gender outcomes of triplets. Focus: Probability and Tree Diagrams |
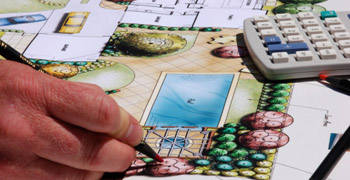 Two-Way Tables and Association Grade: 8 > Full Lesson > PBS link Students will explore how urban planners use associations from data to inform development decisions. They will calculate relative frequencies and identify associations in survey data displayed in two-way tables. Focus: Two-Way Tables and Association
|
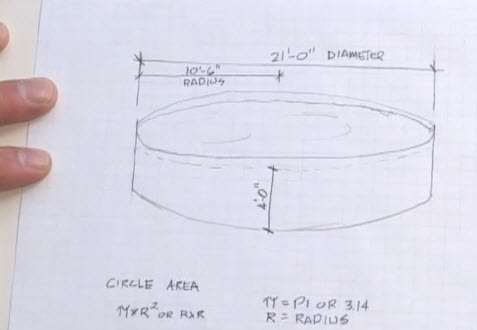 Solving Linear Equations Grade: 8 > Full Lesson > PBS link Students will explore how architect Eric Beck uses linear equations to design buildings. They will solve linear equations to identify measurements in Eric Beck's blueprint. Focus: Solving Linear Equations
|
 Systems of Equations Grade: 8 > Full Lesson > PBS link Students will examine the equations of lines that form intersection points in building designs. They will discover that a system of equations is a pair of equations whose intersection point is a solution to both equations. Focus: Systems of Equations |
 Opposite Quantities and Zero Pairs Grade: 7 > Full Lesson > PBS link Students will use the distance of the ascent and descent of a hot air balloon to illustrate how opposite quantities combine to make zero. They will identify situations that describe opposite quantities. Focus: Opposite Quantities and Zero Pairs
|
 Multiplying a Positive Integer with a Negative Integer Grade: 7 > Full Lesson > PBS link Students will use the heights of hot air balloon flights to solve equations with positive and negative integers using the distributive property. Focus: Multiplying a Positive Integer with a Negative Integer |