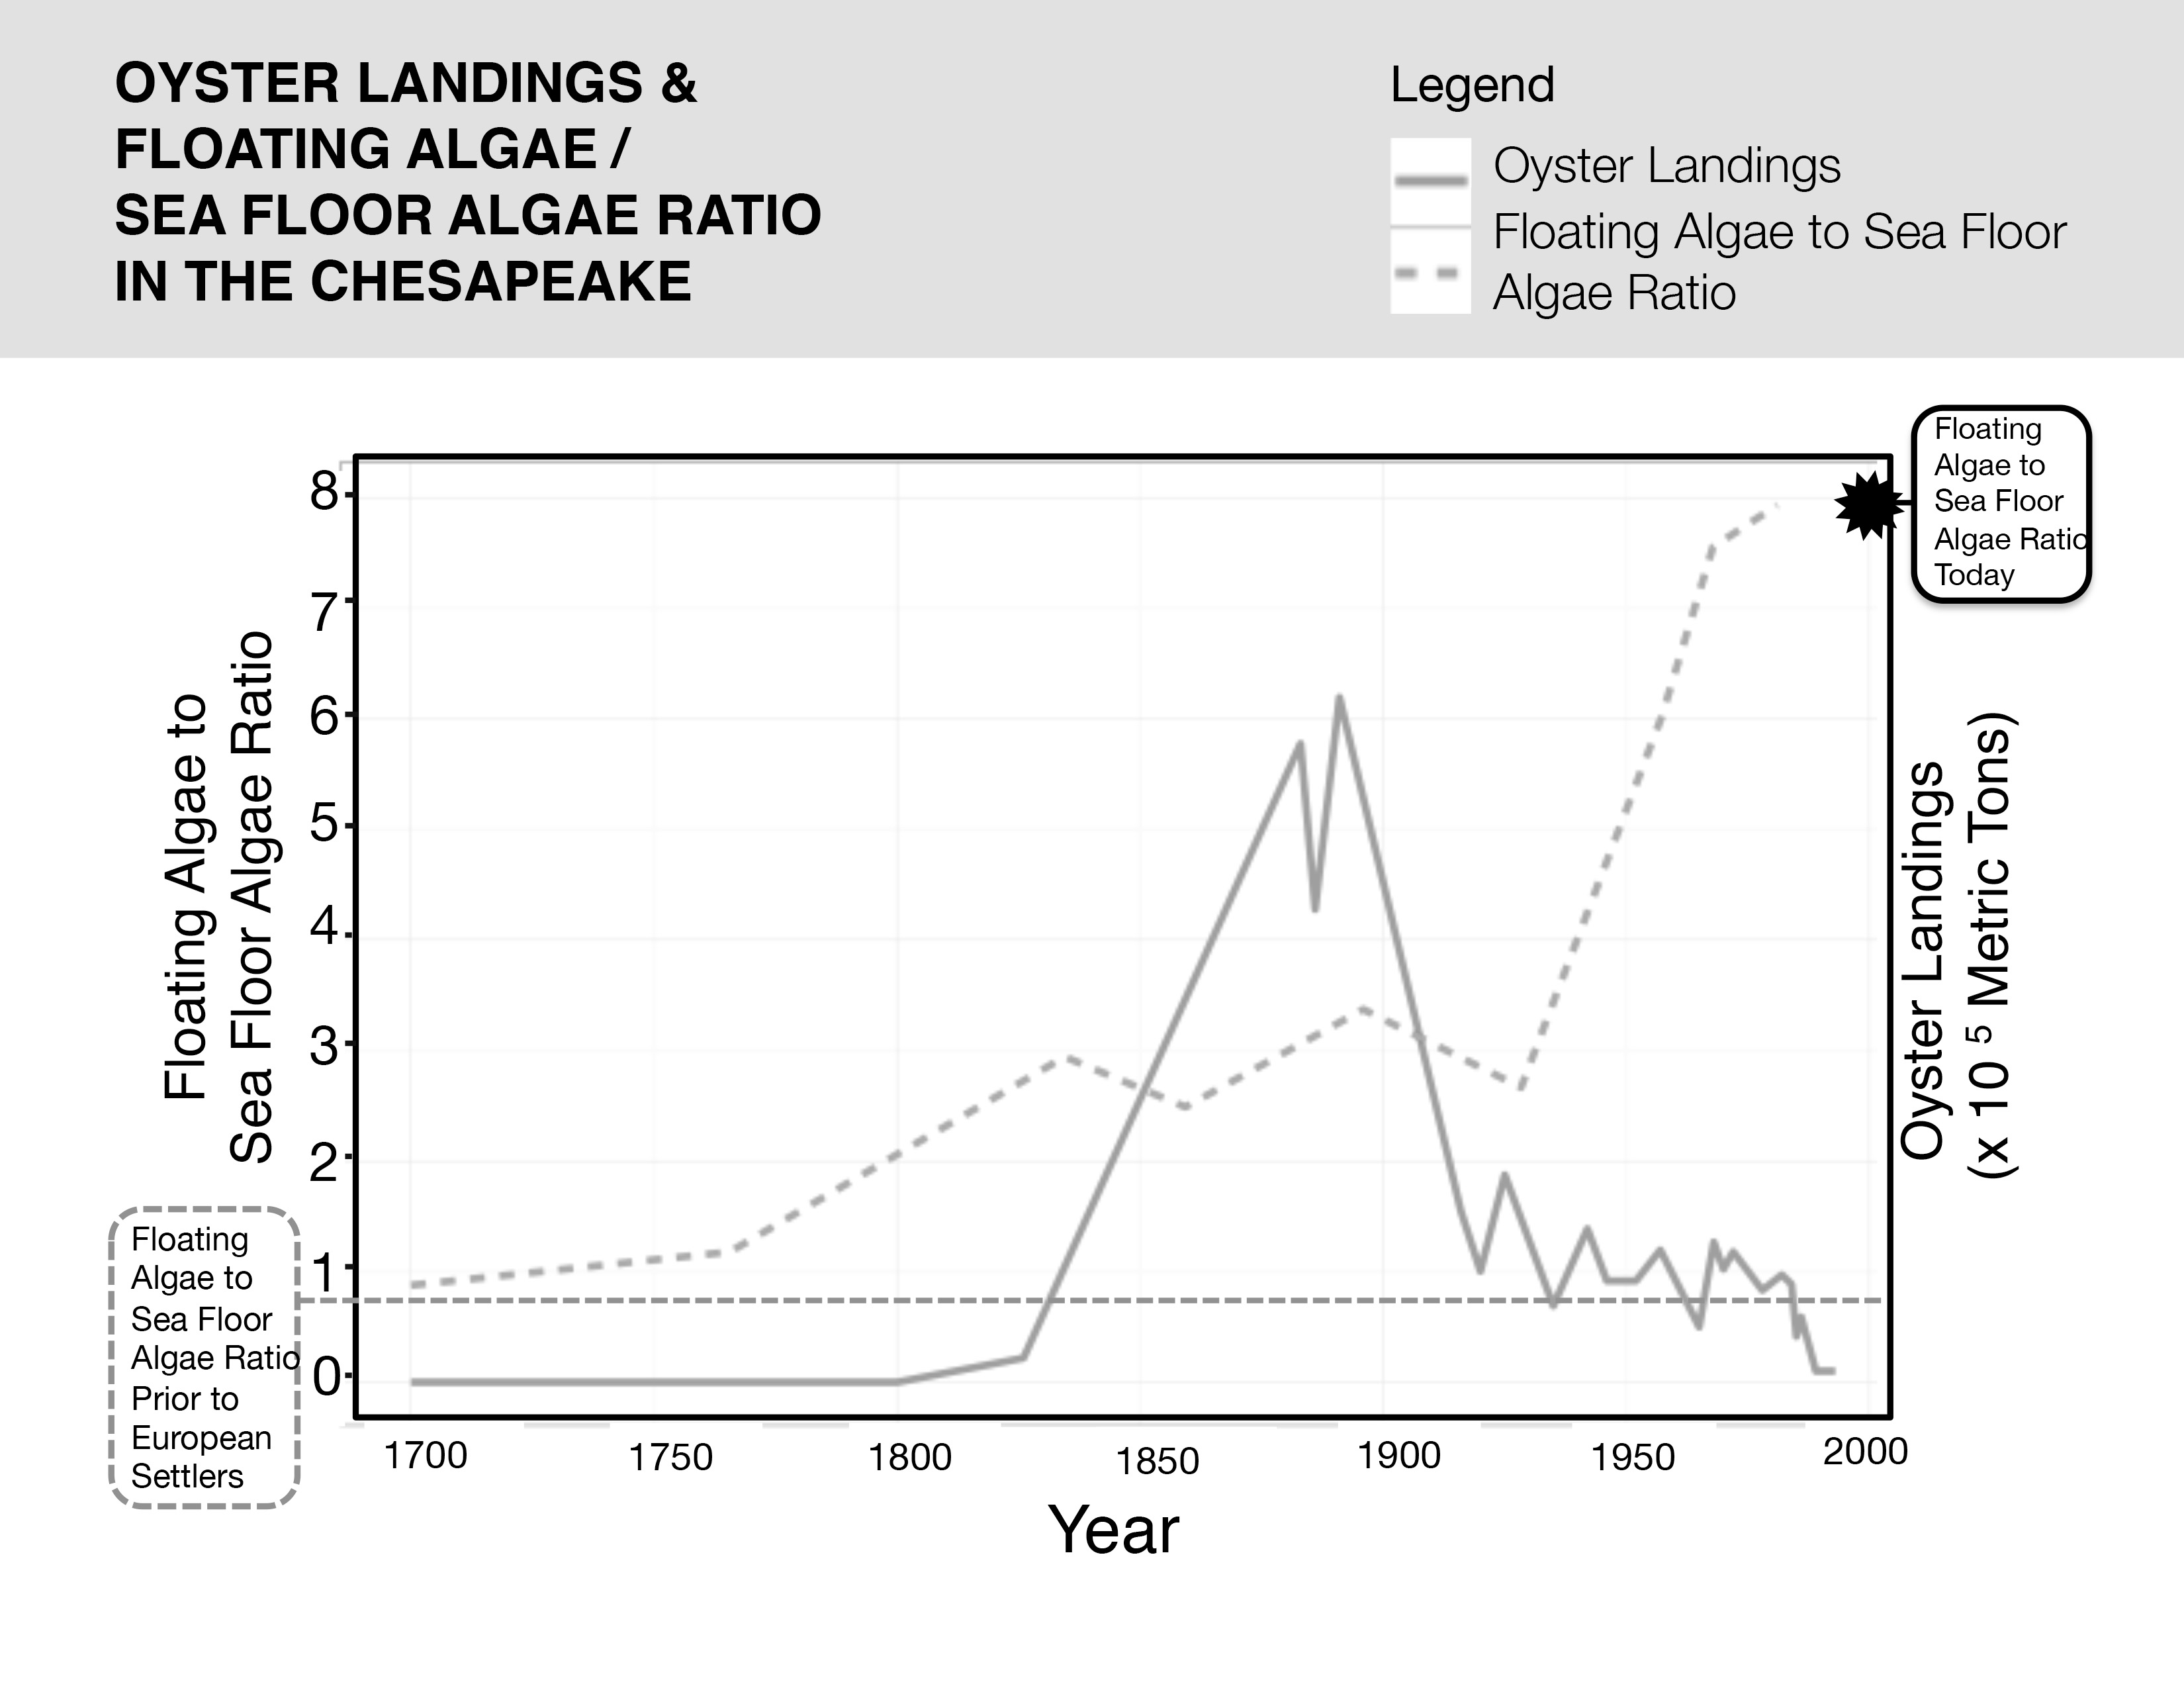
Oyster and Algae Graph
Students will analyze and interpret the graph showing oyster and algae population numbers in the Chesapeake Bay. Students will use this graph as evidence in order to develop arguments related to the relationship between oysters and algae.